Open Journal of Tropical Medicine
Analysis of phenotypic antibiotic resistance profile of Staphylococcus aureus from community settings of a university campus
Asima Zehra*
Cite this as
Zehra A (2020) Analysis of phenotypic antibiotic resistance profile of Staphylococcus aureus from community settings of a university campus. Open J Trop Med 4(1): 015-019. DOI: 10.17352/ojtm.000014Background: The multivariate analysis distinguishes components or factors and establishes associations among antibiotics based on their different levels of correlation.
Objectives: A dendrogram analysis utilizing the clustering algorithm and comparative multivariate analysis on the Minimum Inhibitory Concentration (MICs) of eleven antibiotics, including the vancomycin, was performed.
Methods: A sum of 37 phenotypic resistance profile of S. aureus [10 methicillin-resistant S. aureus (MRSA)], isolated from various community settings of university campuses including Guru Angad Dev Veterinary and Animal Sciences University (GADVASU) and Punjab Agriculture University (PAU), were preselected.
Results: The detection of isolates with elevated MICs against oxacillin, ceftriaxone, tetracycline, and vancomycin suggests the emergence of multidrug-resistant S. aureus isolates resistant to an expanded number of antibiotics. From the dendrogram analysis, an approximate number of unique resistance profiles were 24 and arbitrarily circulated. No relationship or clustering of the resistance profile of isolates was observed. There were no outliers either concerning the sample. On Principal Component Analysis (PCA), the first factor had strong positive loadings on oxacillin, clindamycin, ceftriaxone, erythromycin, ciprofloxacin and trimethoprim-sulphamethoxazole and is largely a concern because of their clinical relevance. The second factor had strong loading on tetracycline and the third factor had a strong loading on Vancomycin (VAN). The first four components defined approximately 71% of the total variance and could easily be represented graphically in a three dimensional scatter plot. In this graphic representation, the eleven antibiotics clustered in four different spatial regions; tetracycline and vancomycin occupied separate spatial positions.
Conclusions: The use of dendrogram and multivariate analysis offers a different approach to draw the inferences from antibiotic MICs and draw some new findings on the relationships between different antibiotic classes.
Introduction
Antibiotic resistance and its transfer to other microorganisms are turning an emerging and serious trend in developing countries like India. Community-associated sources are one such source that is significant in harbouring and spread of antibiotic-resistant microorganisms like S. aureus. They cause an as expanded assortment of diseases both inside the hospitals and in the community [1,2]. It is additionally a significant foodborne pathogen. Though it is ubiquitous, a human is a major reservoir for S. aureus [3]. Treatment and preventive alternatives for this microorganism are confounded by its capacity to adapt to its environment especially through the acquisition of antibiotic resistance determinants. S. aureus resistance to oxacillin carrying mecA gene, now known as MRSA, was first revealed in the year 1961 and from that point forward it has been accounted from hospitals, food, animals, community and environment [1,2].
A common way to compare the activities of antibiotics is matching susceptibility data in a standard manner by using MICs for 50% (MlC50) or 90% (MIC90) of isolates tested. MICs show the interaction of one antibiotic with one microorganism. The comparison of two MICs reflects how one antibiotic acts on two different isolates (dendrogram analysis) or how two antibiotics act on the same isolates (PCA). PCA assists in the identification of the interrelationships of multiple variables, all acting simultaneously [4]. Multivariate methods handle large volumes of data resulting from the interactions of multiple variables and identify principal components that link some of the variables and that unlink other [4]. The graphic, three-dimensional representation of the principal components helps to provide a better understanding of the interrelations among variables. These analyses can be useful for comparing the trend of change in antibiotic resistance.
This study aimed to employ Dendrogram and Principal Component Analysis (PCA) to clarify the general distribution patterns or similarities of clinically important antibiotics against the S. aureus collected from different places of universities (GADVASU and PAU) in the year 2014. Using Dendrogram and PCA, it might be possible to find and describe the correlation between the resistant pattern of each antibiotic.
Materials and methods
A total of 37 phenotypic resistance profile of S. aureus, isolated from different community settings (like Cell phone, Office telephone, Door handle, computer mouse and keyboard, chair arm and tap faucet) of university campuses including Guru Angad Dev Veterinary and Animal Sciences University (GADVASU) and Punjab Agriculture University (PAU), were preselected. Dendrogram and PCA require observations with no blank values, and in the data gathered in this study, different antibiotics were utilized. Just eleven antibiotics were consistently utilized for E-test in all S. aureus isolates. Table 1 shows the descriptive statistics of considered antibiotics. These values were determined and adjusted to the next whole number. The antibiotics included in this study were Oxacillin (OXA), Penicillin (PEN), Tetracycline (TET), Clindamycin (CLI), Ceftriaxone (CTR), Gentamicin (GEN), Erythromycin (ERY), Ciprofloxacin (CPH), Chloramphenicol (CHL), Vancomycin (VAN) and Trimethoprim-Sulphamethoxazole (TSH).
Statistical analysis
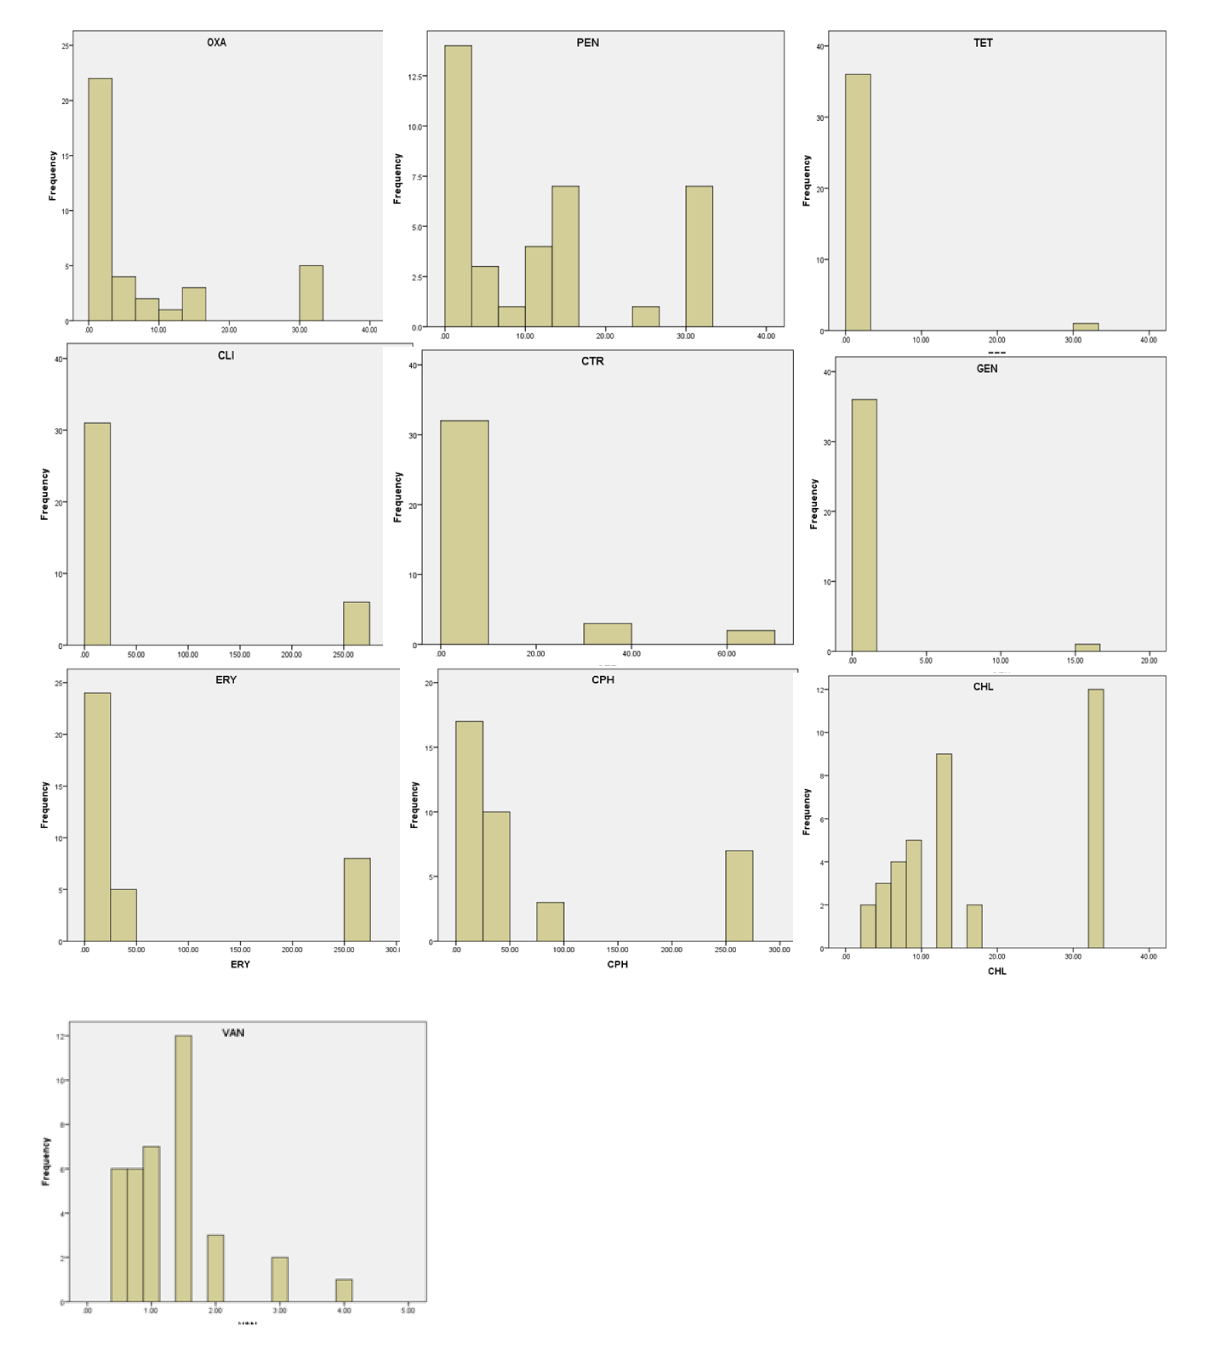
All the statistical analysis was performed using Statistical Package for Statistical Sciences (IBM SPSS V24) software. The range, MIC50, MIC90, and geometric means were obtained by a descriptive statistics analysis. Frequency MIC distributions of each antibiotic were plotted as histograms.
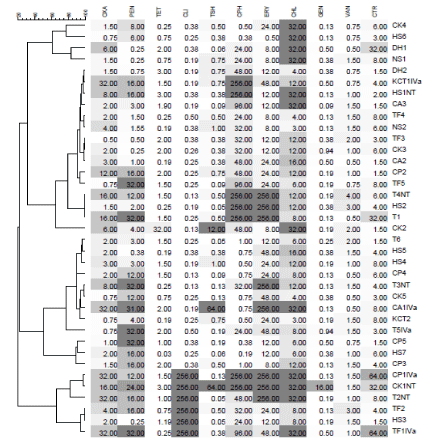
Applied Maths/ BioNumerics software version 7.6 was used for the analysis of MIC distribution and construction of dendrogram based on the antibiogram of respective isolates. The colour scale is defined based on colour range. In the MIC data set the minimum values for all antibiotics was set to 0 and the maximum value to respective higher MIC values (after which the isolate was considered resistant as per CLSI 2017 guidelines). All pairwise similarity values were calculated with a similarity coefficient (Pearson correlation). Then, the resulting similarity matrix was converted into dendrogram with a clustering algorithm (UPGMA- Unweighted Pair Group Method with Arithmetic Mean) [5].
PCA for eleven antibiotics was performed to decide the principal components which explain the maximum variance of the data. In factor analysis, new factors that cause variation in antibiotic MIC values were extracted by varimax/direct oblimon rotation of the PCA. Based on the loadings (coefficients) the original variables that impact a large portion of the values for each factor (retained PCs) are considered.
Results and discussion
In this study, a total of 37 phenotypic resistance profile of S. aureus isolated from different community settings at the university campus of GADVASU and PAU Ludhiana, India [6], were utilized. E-test (Ezy MICTM strip (HiMedia Lab, Mumbai) based MIC values were utilized for 11 antibiotics [Oxacillin (OXA), Penicillin (PEN), Tetracycline (TET), Clindamycin (CLI), Ceftriaxone (CTR), Gentamicin (GEN), Erythromycin (ERY), Ciprofloxacin (CPH), Chloramphenicol (CHL), Trimethoprim-Sulphamethoxazole (TSH) and Vancomycin (VAN)]. Hence the data points are continuous variables. This data thereby can be utilized for the statistical analysis based on a correlation that exists between these variables. The descriptive statistics and the MIC distributions for antibiotics against S. aureus are presented in Table 1, Figure 1, respectively.
S. aureus isolates were non-susceptible to a fluctuated number of antibiotics (somewhere in the range of 0 and 6), with a median of 3. The detection of isolates with elevated MICs against OXA, CTR, TET, and VAN suggests the increasing emergence of S. aureus isolates that are non-susceptible to these antibiotics particularly vancomycin. Thus the thorough analysis of the MIC values to monitor emerging resistance and temporal variation against antibiotics can be utilized to keep a check on the ascent of antibiotic resistance.
Only a few of the isolates were borderline vancomycin susceptible S. aureus (BVS-SA, MIC 2-4 µg/ml) however, none of these isolates was positive for vanA gene. Such isolates are known to show the vancomycin creep (Figure 1). Vancomycin is right now the essential treatment alternative for MRSA [7]. Nonetheless, an expanding number of S. aureus isolates with high MICs, within the susceptible range (vancomycin MIC creep) are being reported worldwide [8]. Recent studies reported reductions inefficacy of vancomycin, not only against MRSA but also against the Borderline Oxacillin Resistance S aureus (BORSA), suggesting that subtle changes in MIC may explain clinical failures [8]. But it is worth to mention that vancomycin MIC creep is a regional problem, therefore it can only be assessed through the evaluation of local susceptibility profiles, and antibiogram based on real MIC assay should be an essential element in local MRSA/BORSA infection clinical management [9].
Isolates classified as susceptible, intermediate or resistant were used to summarize resistance profiles (Figure 2). An approximate number of unique resistance profiles were 24 and arbitrarily circulated. Neither there was a relationship or clustering of the resistance profile nor there were any outliers concerning the sample. Moreover, as our comprehension on the zoonoses is improving it will be worth to do the comparative analysis of these resistance profiles from a community setting with animals/animal houses in and around the same community settings but this is limiting here.
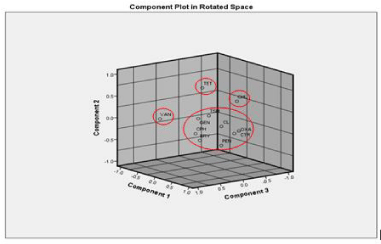
Principal component analysis of the data proved to be an effective tool for data reduction as the first four principal components of all the MIC values explained 70.62% variance. Firstly, it was observed that 9 out of 11 antibiotics correlated at least 0.3 with at least one other antibiotic, suggesting reasonable factorability. Secondly, the Kaiser-Meyer-Olkin (KMO) measure of sampling adequacy was 0.558 that is pretty poor, but above miserable and Bartlett’s test of sphericity was significant (χ2 (55) = 151.16, p < .001). The commonalities were all above 0.3. To increase the reliability of PCA, the two parameters (VAN and TET) that were not correlated with any other antibiotic, were removed for second PCA analysis. Now factorability of the 9 antibiotics was examined. It was observed that none of the values like KMO, and bartlett’s test of sphericity changed, further confirming that each item shared some common variance with other items. Given these overall indicators, factor analysis was deemed to be suitable with all 11 antibiotics. A graphical representation for factor loading of principal components along with their cumulative variance (%) has been given in Table 2, Figure 3.
The first principal component (PC1) explained 34.1% of the total variance; the second 12.8%, the third 12.7 and the fourth 11%. The principal components are represented in Figure 3, which shows graphically the numerical results presented in Table 2. The more similar the chemical structure- or the more similar the mechanism of action or more similar mechanism of acquiring the antibiotic resistance determinants, the closer two antibiotics are in space. There appeared to be four separate clusters of the antibiotics. In the lower corner of the graph, OXA, PEN, CLI, CTR, GEN, ERY, CPH and TSH formed the major cluster (Figure 3). The first PC (PC1) correlates in the highest degree with the MICs of OXA. The loadings for CLI, CTR, ERY and CPH are also significant, but do not differ very much from each other and are of the same order. All these antibiotics have shown a strong correlation with each other in previous studies as well [5,10,11]. In the case of the PC2, the loadings are the largest for TET. PC2 is less correlated with other antibiotics (Table 2). Likewise, for PC3, the loading is the highest for VAN that stood out alone and for PC4, the loading was fairly high for CHL.
The ability of multivariate methods to portray the impact of antibiotic usage on resistance patterns has been suggested before [12,13]. Applying multivariate techniques, those investigators found a high degree of correlation between the activities of OXA, CLI/ERY and CTR against isolates of S aureus and postulated that this species underwent similar evolutionary resistance pressures for these antibiotics. Most of these isolates showed multi-drug resistance. Also, it is noteworthy that VAN appears alone in the spatial characterization described in the current study. Some of the features that could account for the differences observed in the present analysis with VAN are its mechanism of action, its membrane-targeted mechanism of action and its activity against OXA-resistant gram-positive S. aureus [8].
Results from multivariate analysis techniques have evident limitations. They rely basically upon the information or data from which they are produced and the conclusions may not be extrapolated to other collections of information. Additionally, the conclusions can`t be extended beyond the limits of the analysis technique utilized. In the present study, in which only MIC data were considered, no clinical assumptions can be made. This is why dendrogram and PCA should be considered only as additional tools for use in the process of analyzing susceptibility data. Consecutive multivariate analysis over a certain bacterial population may end up helping assess the temporal and spatial development of antibiotics resistance patterns. The sequential application of multivariate methods over evolving bacterial populations could likewise add information to give a better comprehension of the evolving resistance patterns and the mechanisms responsible for them.
Conclusion
This study incorporates just the analysis of the phenotypic resistance profiles of S. aureus isolated from community settings of the universities. Even though the sample size was little for this study, clearly shows the necessity of an exhaustive analysis of the antibiotic MIC values utilizing dendrogram and multivariate analysis. Large sample size and distinctive sample types overtime at a different location can assist with bettering evaluate resistance profiles of S. aureus and MRSA in the general population. Overall, the findings of this study feature the necessity for thorough analysis and drawing of inference.
This study uses the data from the published paper Singh, et al. 2019 to supplement the same study and presented only the statistical analysis of the antibiotic MIC values from that study. As a whole, the article is intended intellectual nourishment. Statistical analysis will be provided to illustrate a possible inference rather than to prove them.
- Abdulsalam M, Gopalakrishnan R, Kumar D, Venkatesh S, Ramakrishnan B (2018) Staphylococcus aureus bacteremia in a tertiary care hospital in India. Indian Journal Medical Specialities 9: 60-64. Link: https://bit.ly/37J1xTs
- Titouche Y, Hakem A, Houali K, Meheut T, Vingadassalon N, et al. (2019) Emergence of methicillin-resistant Staphylococcus aureus (MRSA) ST8 in raw milk and traditional dairy products in the Tizi Ouzou area of Algeria. J Dairy Sci 102: 6876-6884. Link: https://bit.ly/2BjbbQT
- Moellering RC (2006) The growing menace of community-acquired methicillin-resistant Staphylococcus aureus. Ann Intern Med 144: 368-370. Link: https://bit.ly/3hPMrR5
- Kumar M, Ramanathan A, Tripathi R, Farswan S, Kumar D, et al. (2017) A study of trace element contamination using multivariate statistical techniques and health risk assessment in groundwater of Chhaprola Industrial Area, Gautam Buddha Nagar, Uttar Pradesh, India. Chemosphere 166: 135-145. Link: https://bit.ly/2YdzmJp
- Zehra A, Gulzar M, Singh R, Kaur S, Gill J (2019) Prevalence, multidrug resistance and molecular typing of methicillin-resistant Staphylococcus aureus (MRSA) in retail meat from Punjab, India. J Glob Antimicrob Resist 16: 152-158. Link: https://bit.ly/2V0E1fJ
- Singh R, Kaur S, Tomar SJ, Gill JPS (2020) Methicillin-resistant Staphylococcus aureus (MRSA) from community-associated settings. Indian Journal of Animal Sciences 90: 24-28.
- Rubinstein E, Keynan Y (2014) Vancomycin revisited - 60 years later. Front Public Health 2: 217. Link: https://bit.ly/2YfR1QP
- Diaz R, Afreixo V, Ramalheira E, Rodrigues C, Gago B (2018) Evaluation of vancomycin MIC creeps in methicillin-resistant Staphylococcus aureus infections-a systematic review and meta-analysis. Clin Microbiol Infect 24: 97-104. Link: https://bit.ly/2YieS2i
- Diaz R, Ramalheira E, Afreixo V, Gago B (2017) Evaluation of vancomycin MIC creeps in Staphylococcus aureus. Journal Of Global Antimicrobial Resistance 10: 281-284. Link: https://bit.ly/2Co0LQo
- Quijada N, Hernández M, Oniciuc E, Eiros J, Fernández-Natal I, et al. (2019) Oxacillin-susceptible mecA-positive Staphylococcus aureus associated with processed food in Europe. Food Microbiol 82: 107-110. Link: https://bit.ly/3eiiBCi
- Zehra A, Gulzar M, Singh R, Kaur S, Gill J (2020) Comparative analysis of Methicillin-Resistant Staphylococcus aureus (MRSA) and Borderline Oxacillin Resistant Staphylococcus aureus (BORSA) in community and food of animal origin. Journal of Applied Microbiology.
- Jiménez F, Palma J, Sánchez G, Marín D, Francisco Palacios M, et al. (2020) Feature selection based multivariate time series forecasting: An application to antibiotic resistance outbreaks prediction. Artificial Intelligence In Medicine 104: 101818. Link: https://bit.ly/30XPHUr
- Hernandez J, Conforti P (1994) Use of multivariate analysis to compare antimicrobial agents on the basis of in vitro activity data. Antimicrob Agents Chemother 38: 184-188. Link: https://bit.ly/2YPTe4n
Article Alerts
Subscribe to our articles alerts and stay tuned.
 This work is licensed under a Creative Commons Attribution 4.0 International License.


 Save to Mendeley
